Change clusters for time series of 3D point clouds
The VirtuaLearn3D++ framework supports change detection and clustering methods that can be combined to automatically extract change clusters from 3D point clouds.
Data
The dataset used in this example is not publicly available.
JSON
The JSON below was used to 1) quantify point-wise change between the current point cloud and another one from the past in terms of Euclidean distance, 2) compute a cluster with those points that experimented a change in position greater than \(0.33 \; \mathrm{m}\), and 3) extract the final change clusters through DBScan.
{
    "in_pcloud": [
        "/data/pcloud_present.laz"
    ],
    "out_pcloud": [
        "/data/out/*"
    ],
    "sequential_pipeline":[
        {
            "miner": "NaiveChange",
            "fnames": ["euclidean"],
            "frenames":["chg_euclid"],
            "pcloud_past": "/data/pcloud_past.laz",
            "min_distance": 0.1,
            "max_distance": 0,
            "mu": null,
            "sigma": null,
            "hull_filter": {
                "concave_hull_ratio": 0.1,
                "decimation_min_distance": 1.0,
                "fname": "hull_mask"
            },
            "nthreads": -1
        },
        {
            "clustering": "SimpleFeatures",
            "cluster_name": "change_cluster",
            "cluster_value": 1,
            "filters": [
                {
                    "attribute": "chg_euclid",
                    "relational": "greater_than_or_equal_to",
                    "target": 0.33,
                    "action": "preserve"
                }
            ]
        },
        {
            "clustering": "fpsdecorated",
            "fps_decorator": {
                "num_points": "m//5",
                "fast": true,
                "num_encoding_neighbors": 1,
                "num_decoding_neighbors": 1,
                "release_encoding_neighborhoods": false,
                "threads": -1,
                "representation_report_path": null
            },
            "decorated_clusterer": {
                    "clustering": "dbscan",
                    "cluster_name": "change_cluster",
                    "precluster_name": "change_cluster",
                    "precluster_domain": [1],
                    "min_points": 100,
                    "radius": 3.0,
                    "post_clustering": [
                        {
                            "post-processor": "ClusterSelector",
                            "filters": [
                              {
                                "attribute": "number_of_points",
                                "relational": "greater_than_or_equal_to",
                                "target": 1000,
                                "action": "preserve"
                              },
                              {
                                "attribute": "surface_area",
                                "relational": "less_than",
                                "target": 225,
                                "action": "discard"
                              }
                            ]
                        }
                    ]
                }
        },
        {
            "writer": "Writer",
            "out_pcloud": "*change.las"
        }
    ]
}
Visualization
The figure below exemplifies the results of the proposed pipeline computed on a couple of 3D photogrammetric point clouds representing a quarry.
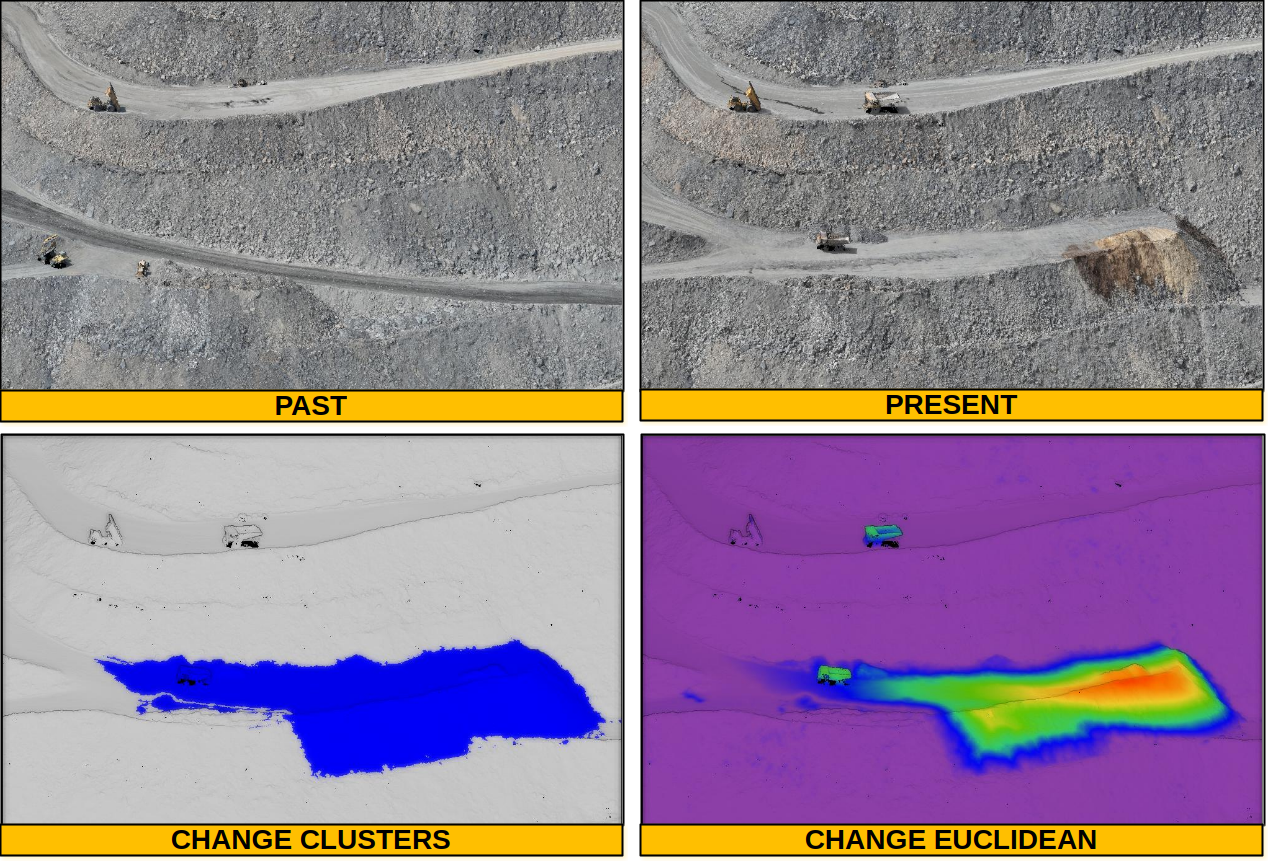
Visualization of the results after applying the pipeline to photogrammetric 3D point clouds representing quarries. The past and present of the same region is represented with point-wise RGB colors. A change cluster (blue) and the Euclidean distance are also represented. The Euclidean distance is colored from violet (zero) to red (\(15 \; \mathrm{m}\)).
Application
Change detection is an important method for many applications involving 3D point clouds. It enables the automatic extraction of regions that have experienced a significant change over time. The method illustrated in this example can be easily adapted to different datasets and applications by tuning its main hyperparamenters, e.g., the Euclidean distance threshold or the minimum number of points per cluster.